Adding content doesn’t have to be just about images, video and text. Interactive pages of use to your visitor can create stickiness – google likes that!
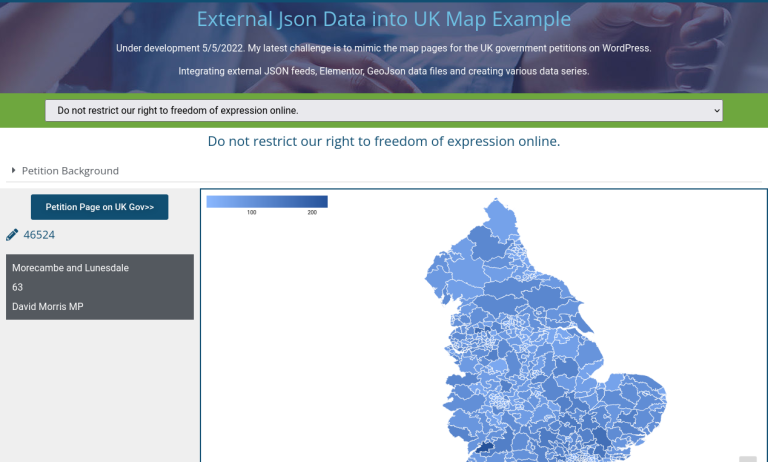
There are thousands of public datasets but as an experiment we decided to add an interactive map of the open petitions on the UK government website.
Finding The Data
There is a page listing open UK petitions here, which is great but no good for our purposes as we want to pick up all the details programmatically. But conveniently at the bottom of the page is a link to the JSON feed for all open petitions.
Chart and Maps Plugins
As you can imagine there are a number of different chart and map plugins for WordPress, all providing different functionality. For this project, and to keep it free, we decided on the AM Charts facility and their WordPress plugin.
Drawing Out The Map
This was the trickiest part of this implementation! Finding the geo data on the boundaries of the constituencies in England. The data from the government site provides the data in relation to the constituency but we need to draw the map displaying the constituency boundaries. Finding this inforamtion needed some detective work but if you looking at doing a similar project you can find it the constituency boundary data in geojson format here